
Intended Side Effects
Data always tells a story —but not always the full one.
I bring a designer’s eye to complex code, creating honest data visualizations that center human and more-than-human stories.
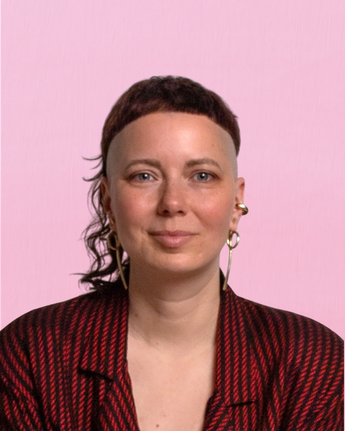
👋 Hi, I'm Janina, a data scientist and visual storyteller.
Data is never neutral. It often touches lives, land, and histories that do not fit neatly into metrics. My passion is to bring the human context back into the numbers, transforming complex datasets into clear, beautiful, and compelling visual stories that look beneath the surface.
Whether a dataset has only a few numbers or millions of rows, I treat data as investigative material. My background in design and sustainability taught me that numbers alone never show the whole truth. I look closer to uncover what’s missing, creating visualizations that help people truly connect with the stories and environments impacted.
I am looking to collaborate with newsrooms, research initiatives, and organizations to bring complex stories to life and make them memorable.
Let’s connect! ✨
Services
Data Storytelling & Design
I can help you turn complex, messy datasets into honest, beautiful, and high-impact visual stories tailored to your audience or newsroom.
Speaking
I can help you inspire your audience with engaging talks on the intersection of data science, critical design, and human-centered stories.
Training & Mentoring
I can help you master data visualization, Tableau, and Python through hands-on training focused on clarity and deep context.
Portfolio
This is a collection of recent projects, created with Python, Tableau, Blender, Next.js and React.
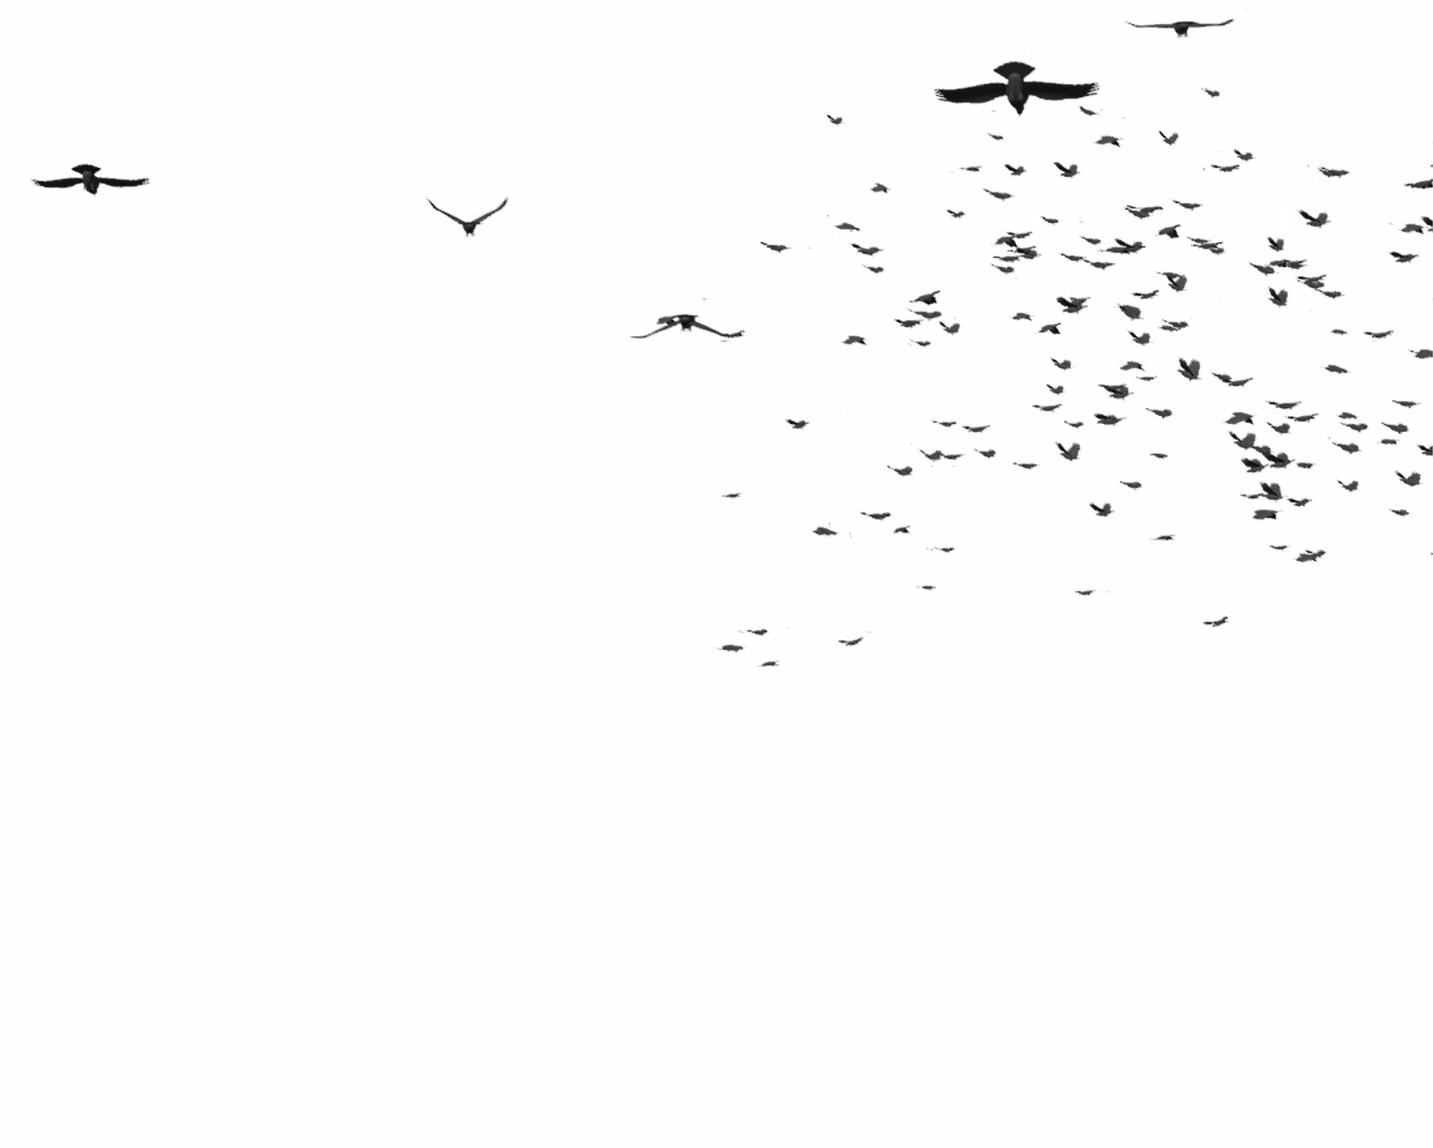
LOSS I
An interactive story about extinction, memory, and silence. Part I of the LOSS series.
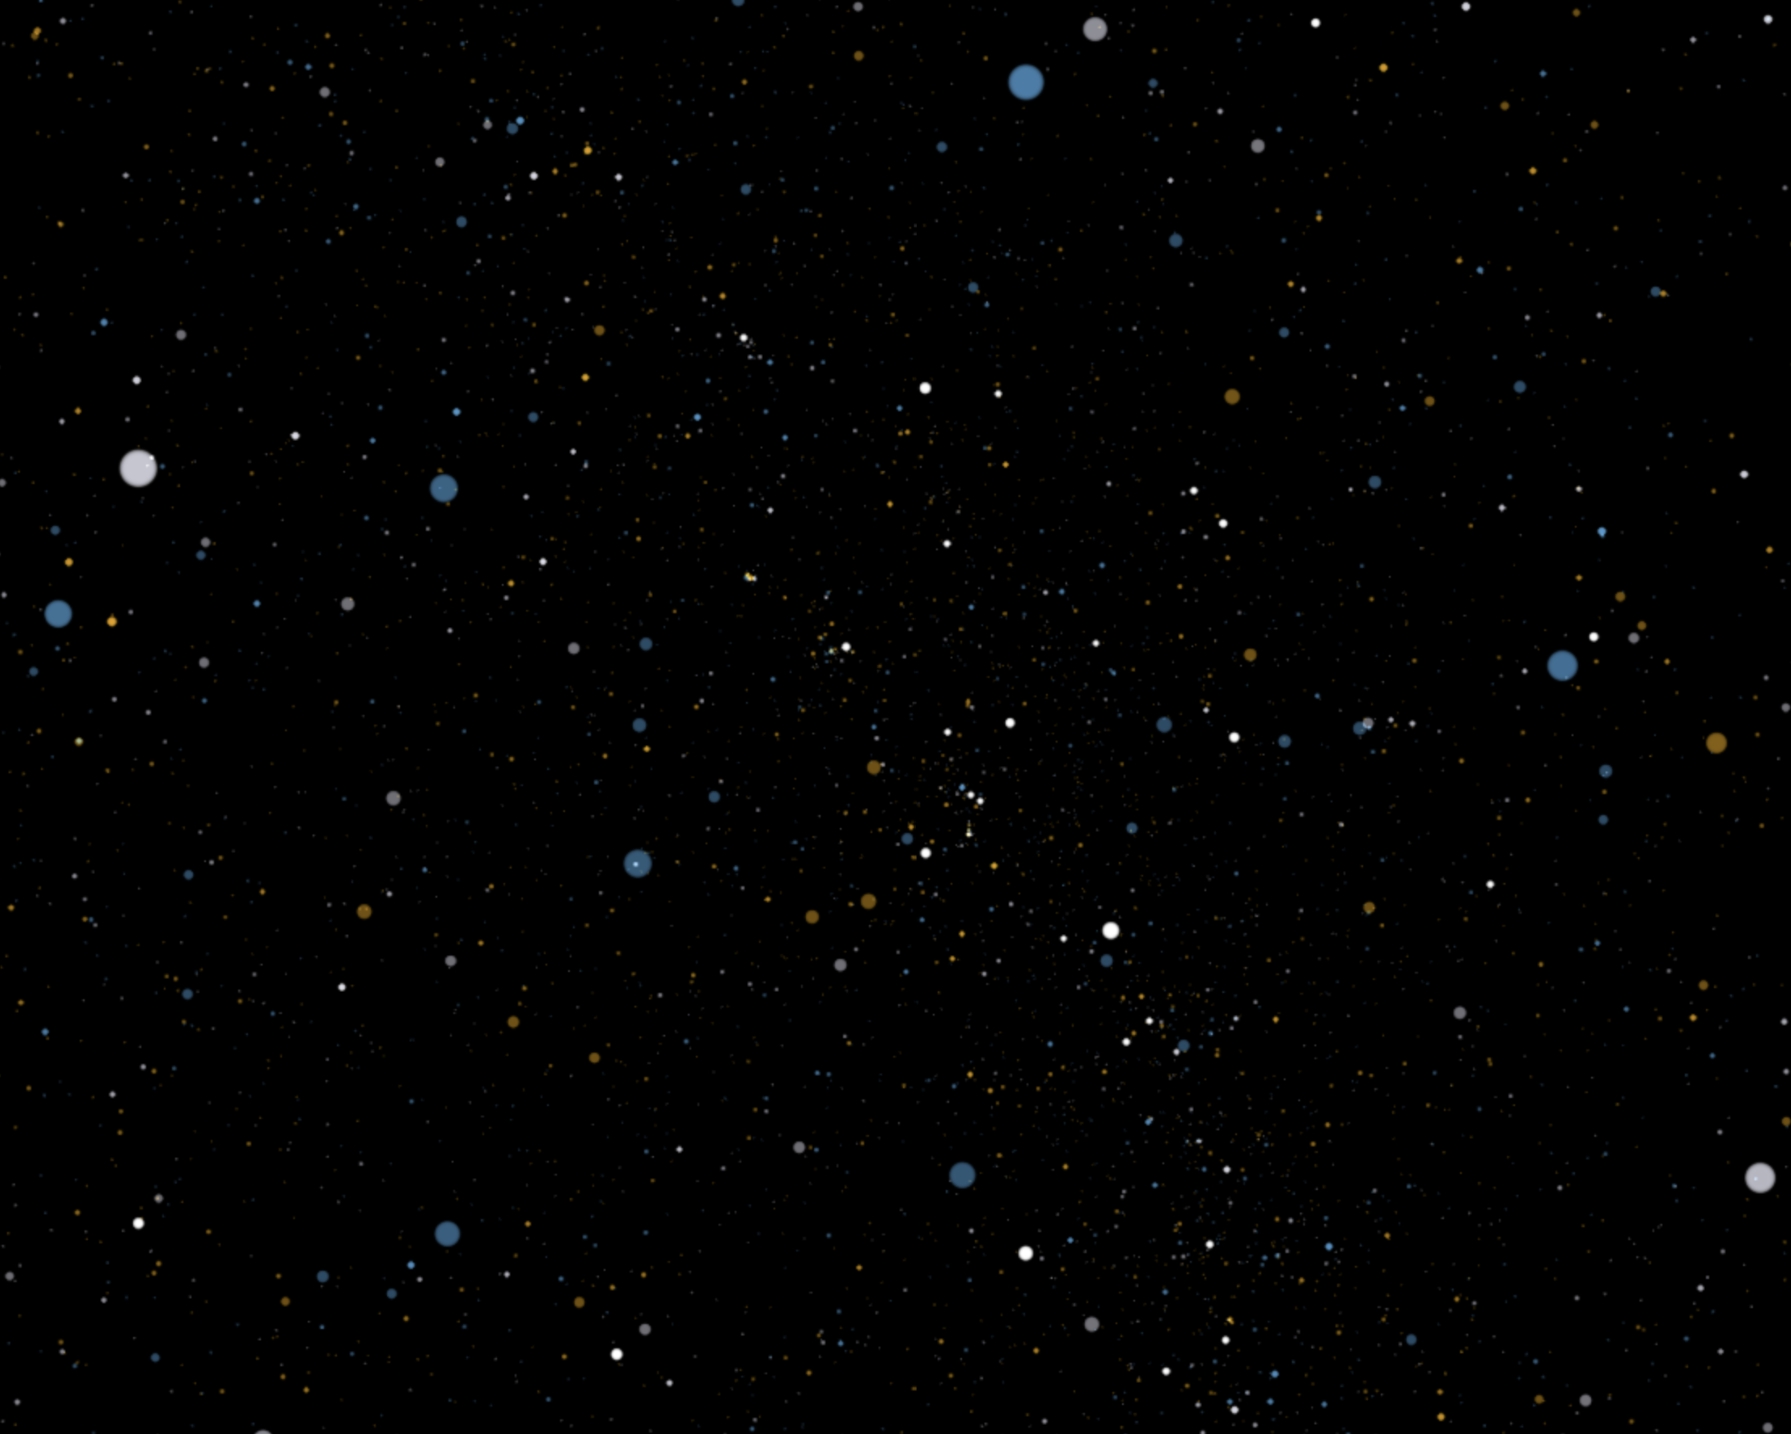
LOSS II
An interactive story about fading skies, forgotten stories, and cultural loss. Part II of the LOSS series.
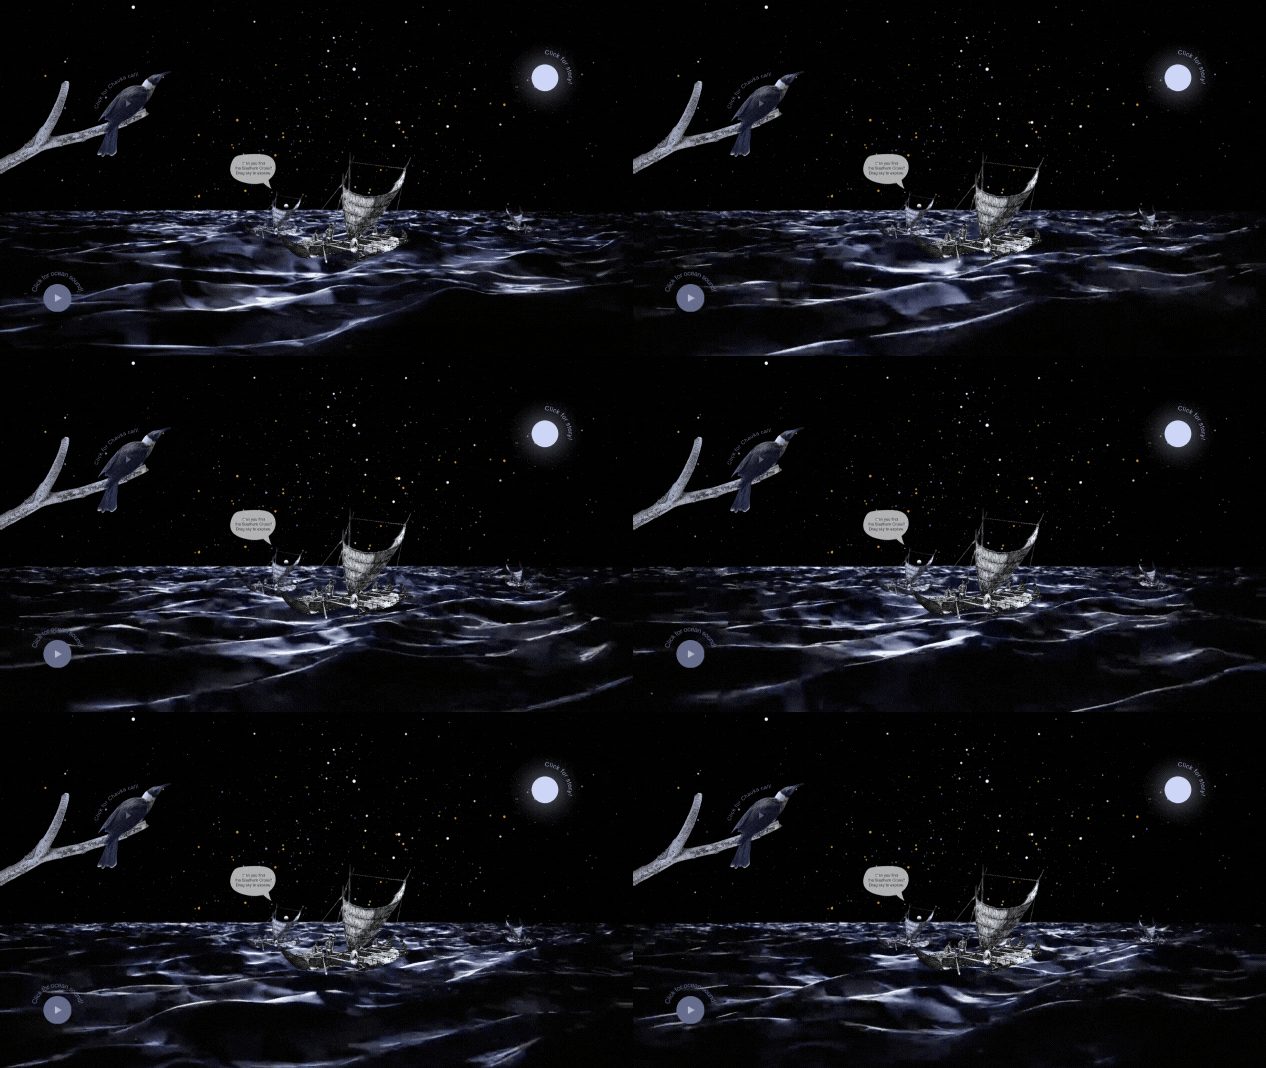
CHAUKA
Contribution for Pacific Dataviz Challenge 2025
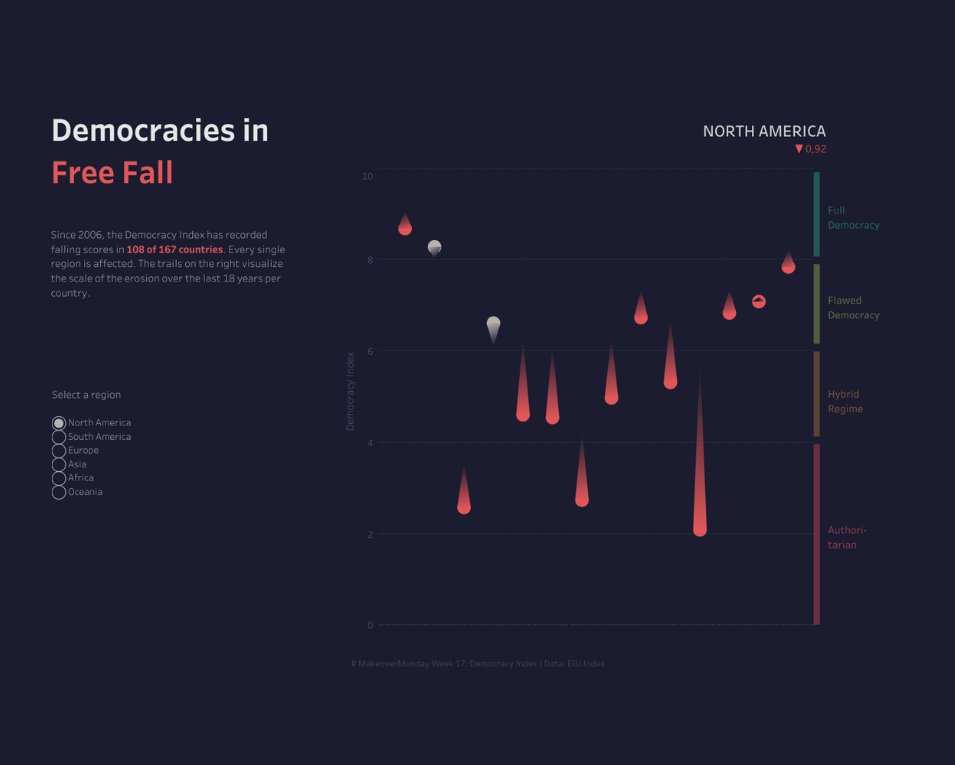
DEMOCRACIES IN FREE FALL
This data journalism piece uses custom "free fall" trails to transform long-term index tracking into an impactful, narrative-driven experience.
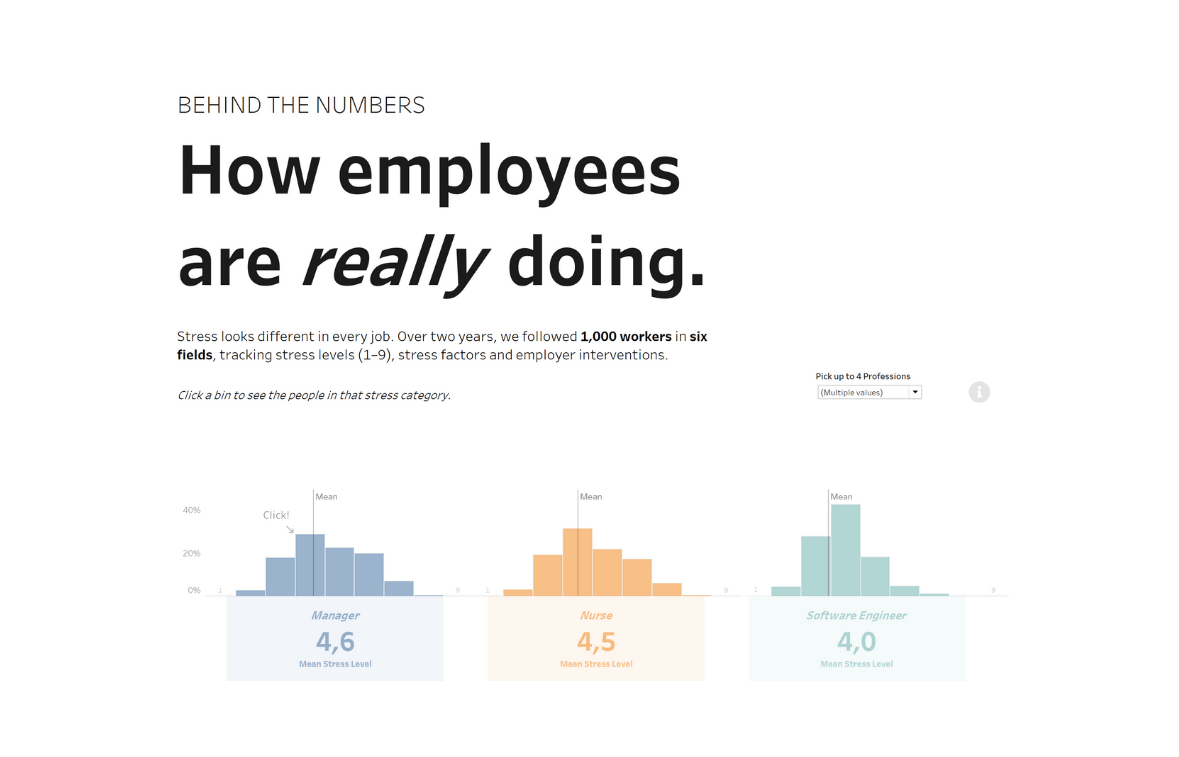
BEHIND THE NUMBERS
Stress looks different in every job. Over two years, we followed 1,000 workers in six fields, tracking stress levels, stress factors and employer interventions.
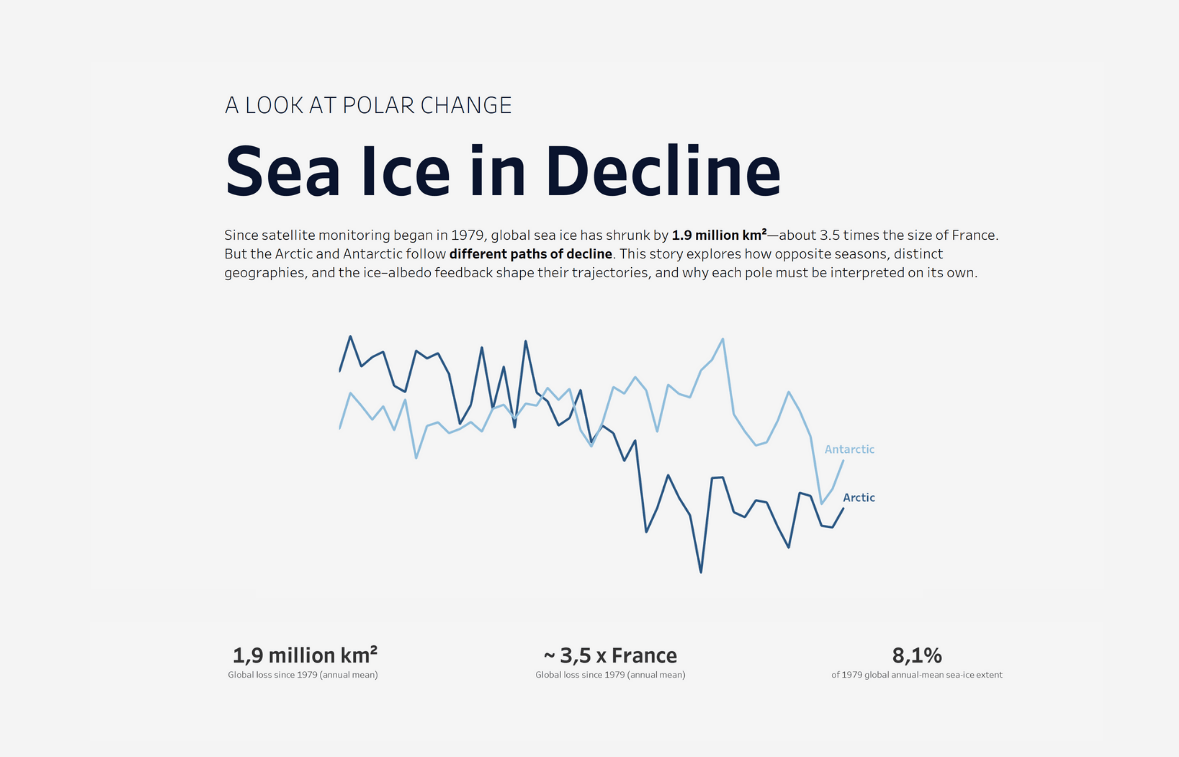
SEA ICE IN DECLINE
This story explores how opposite seasons, different geographies and the ice-albedo feedback shape those paths, and why looking at them separately matters when interpreting change.
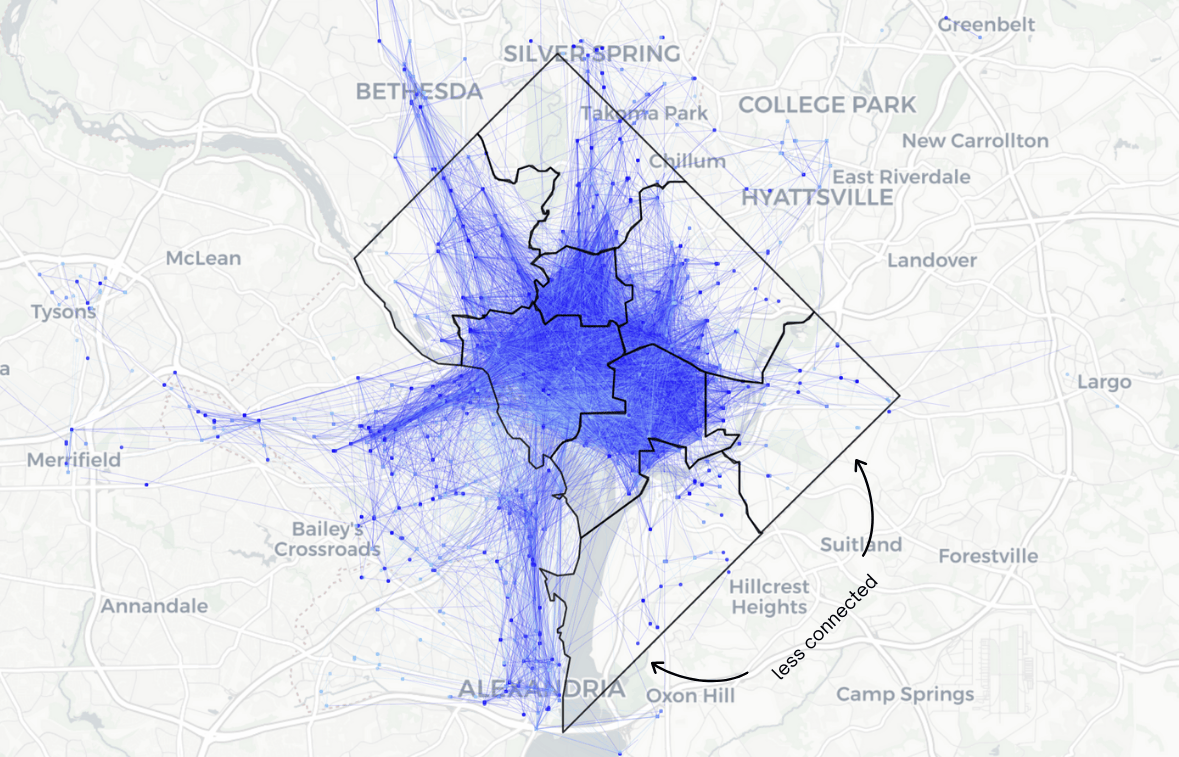
DisConnected
Why are some communities in Washington, DC still disconnected from bikesharing? A data-driven investigation into mobility, access, and who gets left behind.
TASTING VERDE
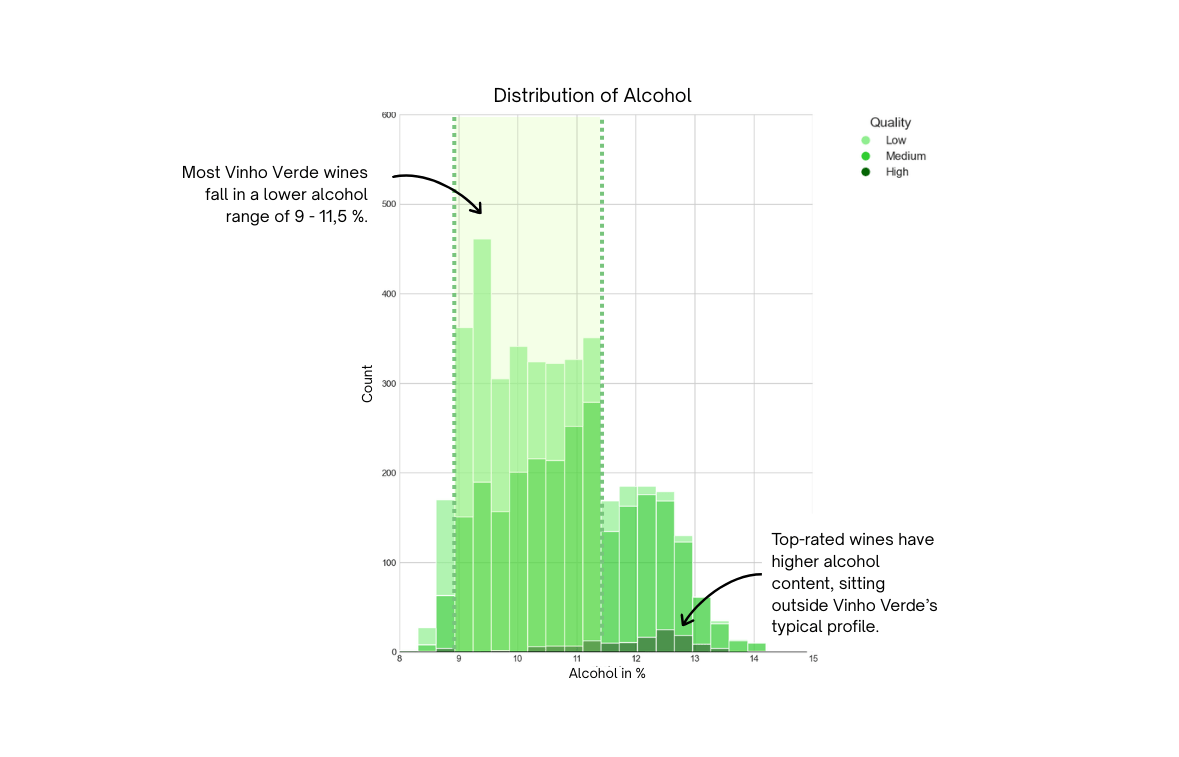
Is Vinho Verde being underrated? A machine learning analysis of Vinho Verde wines that explores whether their distinct properties invite bias in traditional quality assessments.
LOSS I
An interactive story about extinction, memory, and silence. Part I of the LOSS series.
LOSS II
An interactive story about fading skies, forgotten stories, and cultural loss. Part II of the LOSS series.
CHAUKA
Contribution for Pacific Dataviz Challenge 2025
DEMOCRACIES IN FREE FALL
This data journalism piece uses custom "free fall" trails to transform long-term index tracking into an impactful, narrative-driven experience.
BEHIND THE NUMBERS
Stress looks different in every job. Over two years, we followed 1,000 workers in six fields, tracking stress levels, stress factors and employer interventions.
SEA ICE IN DECLINE
This story explores how opposite seasons, different geographies and the ice-albedo feedback shape those paths, and why looking at them separately matters when interpreting change.
DisConnected
Why are some communities in Washington, DC still disconnected from bikesharing? A data-driven investigation into mobility, access, and who gets left behind.
TASTING VERDE
Is Vinho Verde being underrated? A machine learning analysis of Vinho Verde wines that explores whether their distinct properties invite bias in traditional quality assessments.

Janina was one of my mentors during Data Science & Machine Learning course at Code Academy Berlin.
I appreciated her as an infinite source of inspiration when it came to ideas for data visualization. Janina helped me a lot to fine-tune my approach to story-telling with data. In doing so, she made me reconsider how to present data to different aud…
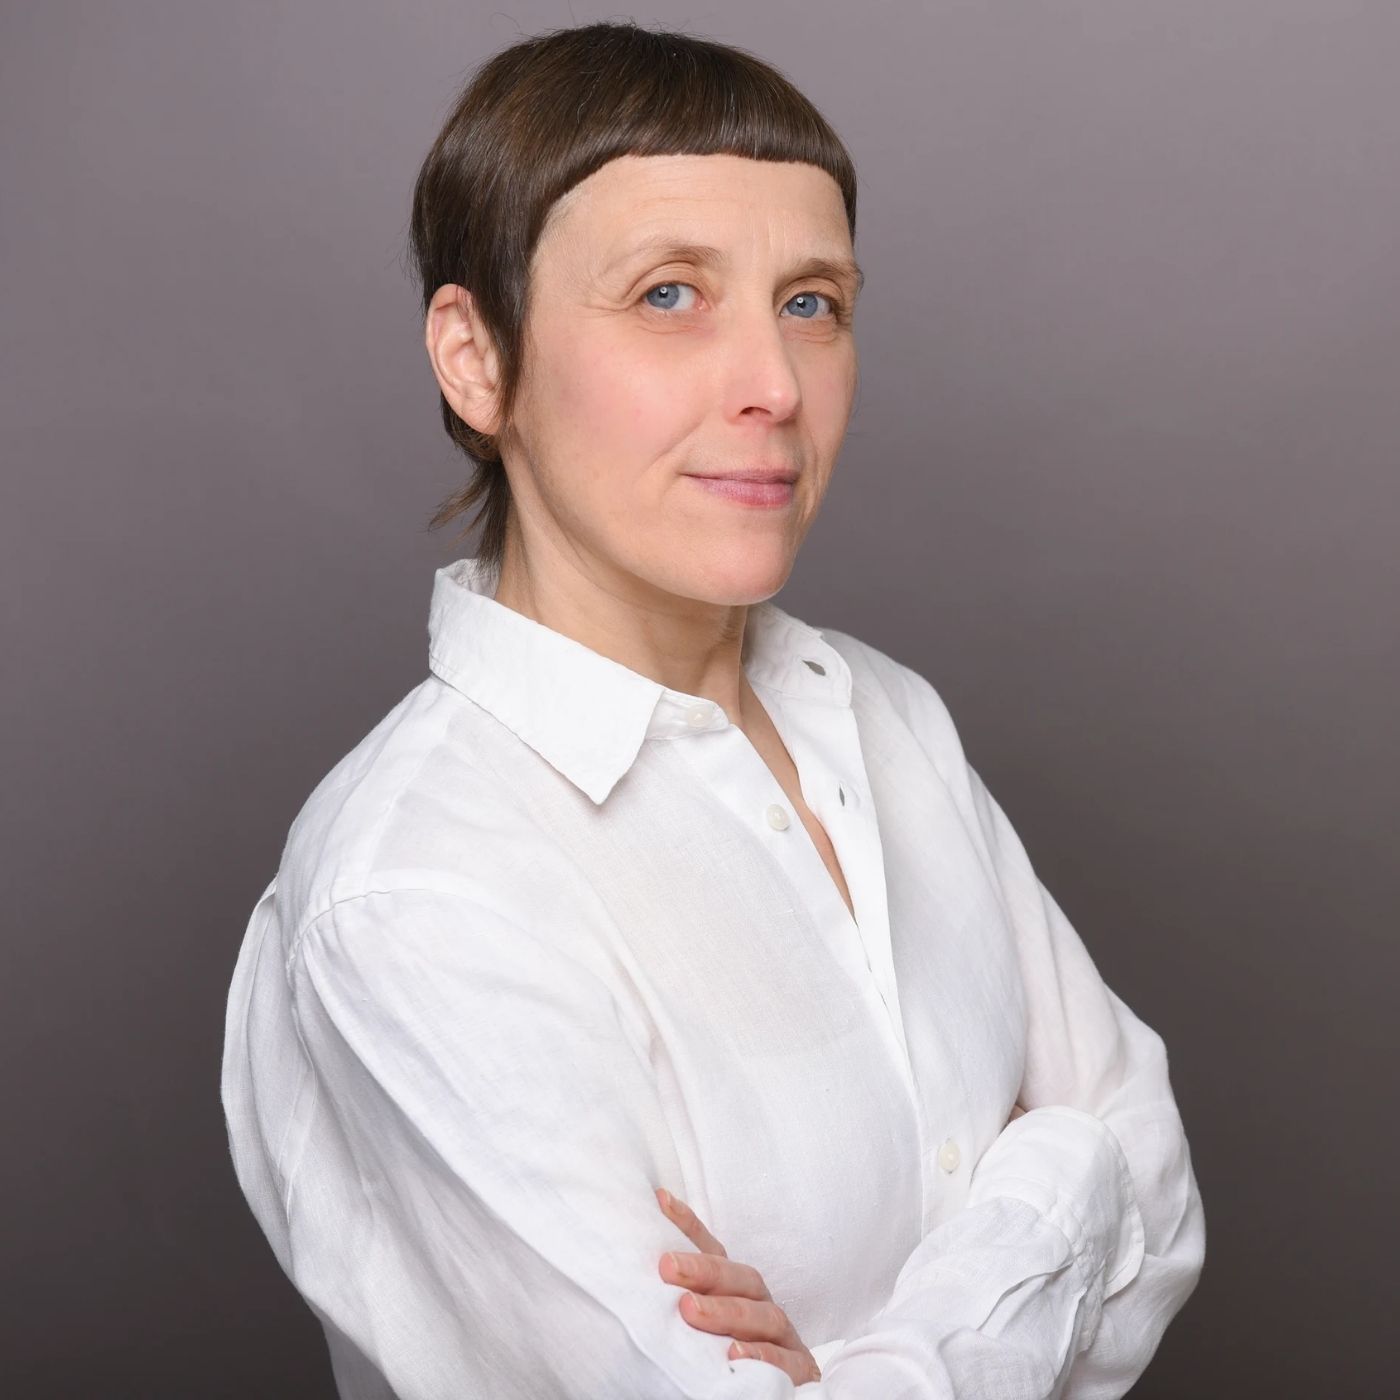
Janina was my mentor during the Data Science & Machine Learning course at Code Academy Berlin.
I appreciated her clear and well-structured classes, as well as her availability whenever I faced a blockage. Her feedback after presentations was invaluable—especially her focus on storytelling, visualization clarity, and design. What stood out even mo…
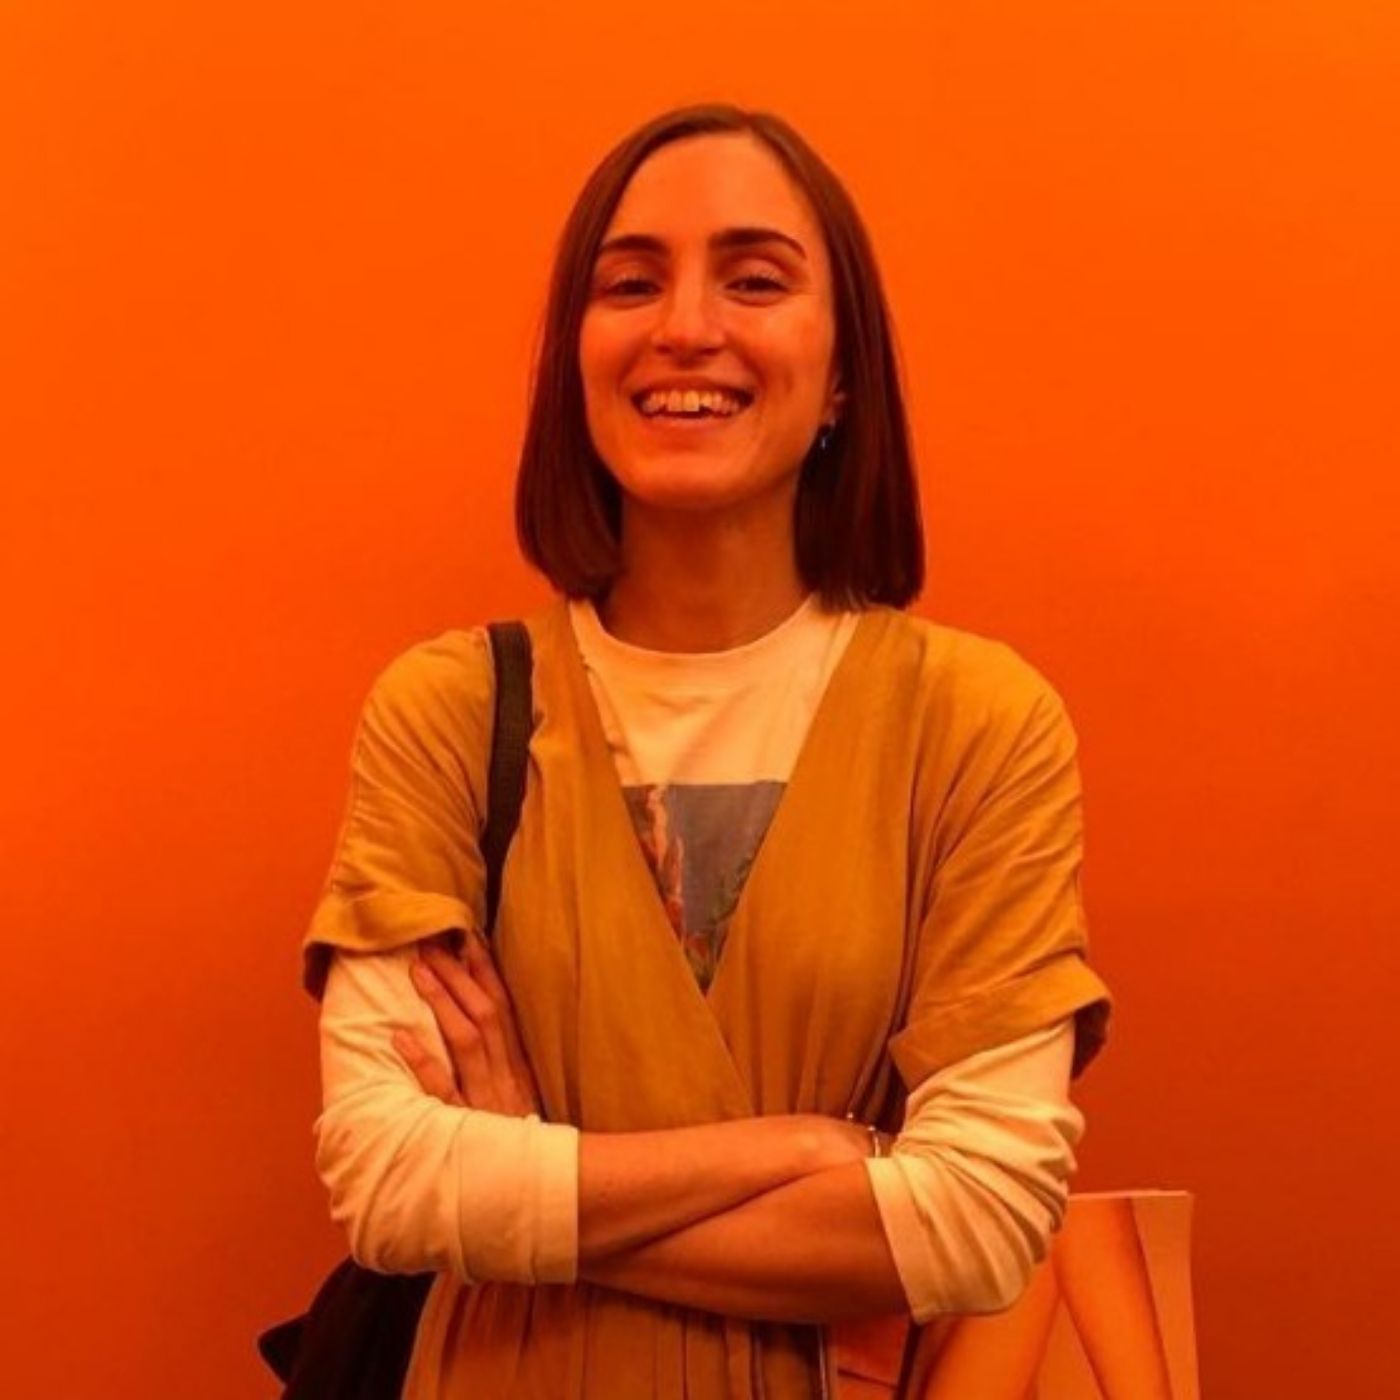
Janina and I worked together over the past two years on a project to implement a new and unique circular initiative within the business. [...] Her passion, dedication, and willingness to pursue challenges until she found a solution was inspiring. [...] She is open to learn, open to feedback and constant improvement, and a true pleasure to work with…

I worked with Janina on a sustainable stockroom project. Her forward-thinking, solutions-focused attitude ensured that this project stayed focused, efficient and on track. [...] She approaches every task in a positive and proactive way and is constantly looking to develop her knowledge.
This is what I know.
I´m highly skilled in data visualization, programming and storytelling. You can explore my skills below.
Contact
Have a dataset that needs a designer’s eye or a story that shouldn't be ignored? Feel free to reach out for collaborations, speaking, or training. Let’s build something meaningful together! ✨
loading...